
 Functional Description/approach:
The guiding principle of this tool is that it takes a minimum amount of data-entry to generate a maximum of useful information. Ideally, data can be entered from the field in real time; I am working on developing tools for easier/automated task tracking. Currently, however, a lot of farmers want to keep paper notes and then do data entry at the end of the day or week. Here are some printable templates for note-taking.
Here is a link to a sample copy of the tool. The project is in its first beta version, so please do not make a copy on your own. I will be refining and updating it, and I want to keep track of how it's being used. This copy is just for messing around and seeing how it works. It is public, so others may have left data entries in it. I will keep an eye on it to see that it doesn't get broken. For your own copy with free setup assistance and technical support, read on.
Functional Description/approach:
The guiding principle of this tool is that it takes a minimum amount of data-entry to generate a maximum of useful information. Ideally, data can be entered from the field in real time; I am working on developing tools for easier/automated task tracking. Currently, however, a lot of farmers want to keep paper notes and then do data entry at the end of the day or week. Here are some printable templates for note-taking.
Here is a link to a sample copy of the tool. The project is in its first beta version, so please do not make a copy on your own. I will be refining and updating it, and I want to keep track of how it's being used. This copy is just for messing around and seeing how it works. It is public, so others may have left data entries in it. I will keep an eye on it to see that it doesn't get broken. For your own copy with free setup assistance and technical support, read on.
Special thanks to Glynwood for supporting the early development of this tool while I was a CSA apprentice there.
How to Use the Tool:
I have added notes within the tool. Whenever you see a black triangle in the upper-right corner of a cell, you can click that cell for some information about that area of the tool.
IMPORTANT NOTE: Never add rows or attempt to sort any ranges, columns, or sheets. If you want to see your data sorted, I recommend using Google's "Filter Views" feature, which you can access by clicking "Data" > "Filter views..." > "Create new filter view." Please contact Bill (illyblc@gmail.com) if you have any questions about this or if this is not sufficient for your needs.
Getting Started
The first step is to enter a list of all the cops that will be tracked, the names of all the tasks that will be performed (hand weed, irrigate, transplant, etc.), and the distribution channels through which the crops will be sold (markets, restaurants, food banks, etc.). (There is a separate section for CSA distribution, which will be explained later.) These lists are then automatically populated elsewhere in the tool.
"Pricing" Enter your list of distribution channels in the first column of this sheet, and your crop list in the fourth. "CSA" is fixed in the list of distribution channels because the tool includes specialized tools for dealing with CSAs. If your farm does not have a CSA, just ignore this. Under "Crops," I recommend including something like "Farm General" to help you keep track of the cost of tasks that are not associated with specific crops, such as mowing around fields. This will make more sense later when you are familiar with the WorkLog sheet and the various reports generated from the data you enter there.
The next step here is to enter the names of your various pricing schemes into the row of orange cells. If you have only one set of prices, great; just give it a name. If you have fifteen or more, wow. Contact me and I'll make more space. In any case, fill in the names you want to use, i.e. "Wholesale," "Direct Sales," "Donations," "Low Income Market," "Rich People's Market," whatever you like. Once you've added these names, they will become the choices in the drop-down lists under "Pricing Scheme" in the second column of the sheet, so you can associate each distribution channel with a pricing scheme. Note that "CSA" is pre-filled as a channel; if you want to track the value of your CSA distributions, please assign it a pricing scheme. If you don't have a CSA, you can ignore it. Next, add the price per unit of each crop into the table. Each column headed with the name of a pricing scheme should have a dollar (works for other currencies, too) amount for each crop that's going to be distributed through the channels that have that pricing scheme. You do not have to specify the unit (heads, bunches, pounds, etc.), just be sure that the price reflects the units that will be distributed to the venues with those prices. This may seem confusing and like it is a lot of work, but it will pay off with extremely detailed distribution information later.
"Labor Cost" The next piece of setup is the labor cost calculator, into which you can enter some basic data about the wages and makeup of the farm crew. Here a percentage of "non-assigned time" can be entered, effectively increasing the cost of labor per hour to account for time not spent of specific tasks, i.e. driving between fields. (Thank you Richard Wiswall.) The "Fringe Benefits" is for any other costs associated with employing labor, such as housing or meals. It assumes a 40-hour work week. I don't think most operations will need to use this, but there it is for those that do.
"TaskList" Finally, you can enter your tasks and the costs of various materials. Enter a list of all the tasks that you want to track on your farm. Each task can have one material assigned to it in the next column. Each material is given a cost per unit in the following column, and the unit is named in the final column. For example, if the task is drinking beer and the beer is $10 for a six-pack, then the user may define the unit as either one bottle or one six-pack, with the price per unit as either $1.67 or $10, depending on which is more useful. Unfortunately at this time only one material can be assigned to each task, so your task list must contain a distinct task for each material. For example, if you sometimes spray A and sometimes spray B, you cannot simply have "Spraying" as a task if you want to track the costs of materials, because it can only be associated with one material or the other. You will have to have tasks like "Spaying A" and "Spaying B" and associate those with materials A and B, respectively. Note: I recommend including something like "Farm General" in the list of crops so that tasks not related to specific crops can still be tracked (i.e. mowing). Also, things like compost can be included as crops if you want to know how much it costs to produce them.
Keeping Records and Viewing Reports
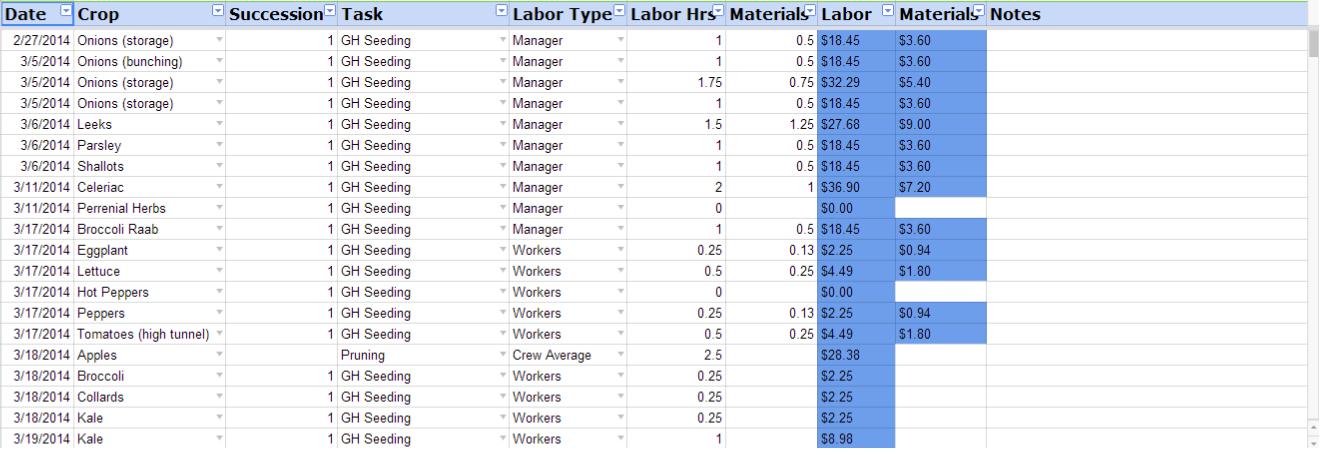
"WorkLog" In day-to-day (or weekly) use, make entries in the WorkLog table including Date, Crop, Succession, Task, Labor Type, Labor Hours, Materials, and Notes. For example, if the assistant manager spent two hours drinking six bottles of beer in the first succession of carrots on May 5, the data entered would look like, "5/5/2015, Carrots, 1, Drinking Beer, Assistant Manager, 2, 6, malty." The crop, task, and labor type fields can filled using a drop-down list featuring auto-complete. If you don't want to keep track of who is doing which work, you can select "Crew Average" as the labor type. The materials field indicates the number of units of relevant material used, a unit being whatever you have previously defined. The labor cost and material cost of each activity will appear in the last two columns. Using Filter Views, you can generate a complete history of each crop.
"Planting Record" Every time something goes into the ground, a separate entry is made on the Planting Record sheet, including the location and number of bed feet of the planting. Again, the crop name is chosen from a drop-down/auto-complete list. This table is important in that it tells the system how many bed feet each planting takes up, yielding important cost/foot and profit/foot type information elsewhere in the tool. Also, it preserves useful crop rotation information and can be sorted by field name, crop, etc. Note: The "Beds" column is intended for bed numbers or names, rather than numbers of beds. However, it can be used either way.
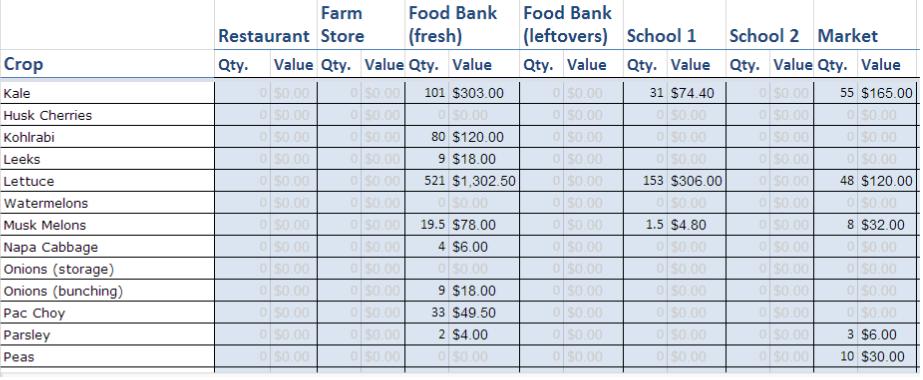
"Distribution" Distribution data is collected similarly in a table with Date, Channel, Crop, Succession, and Quantity, again with drop-down lists. The price per unit and value of the given quantity of the crop are looked up and calculated by the tool and displayed as the final two columns of this table. The total distribution quantities and values are also automatically calculated for each crop in each channel (i.e. $1,302.50 of lettuce donated to the food pantry), and displayed on the "Dist. Report" sheet.
"CSA" On this tab, similar records are collected for CSA distribution. Enter the date in the first column, and the day of the week will appear in the section on the right side of the sheet, under "Dist. Day." For each Dist. Day, enter the number of CSA shares that are distributed on that day of the week (e.g. 50 on Tuesdays). Getting back to the left side, enter the crop, the succession, and the quantity per share. The next two columns give the value of that quantity of that crop and the value of the whole distribution of that crop for the day (value of one share times number of shares). You will see that the pickup days have appeared in a section on the right side of the sheet under "Totals per Share." Enter the number of shares to the right of each day. This sheet also displays a summary of each pickup with the number of items and the value, as well as running totals of the value per share throughout the season.
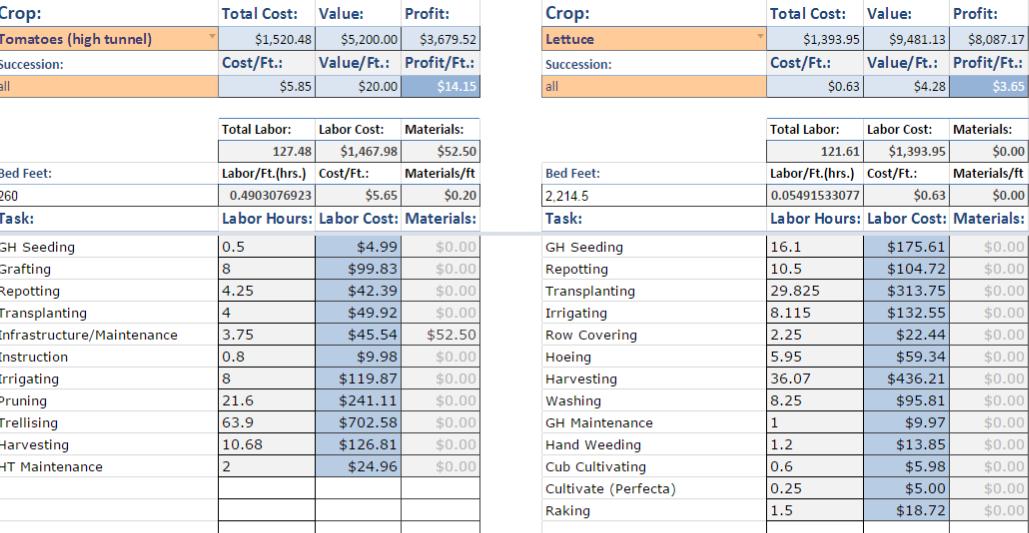
"Crop Report" On the "Crop Report" sheet, select a crop and a succession (or choose "all" successions) to see a breakdown of the total number of hours spent on each task, the dollar cost associated with that, the total cost of production, the total value distributed, and the potential profit, as well as the cost, value, and profit per foot. All of this information is of course calculated by the tool. This sheet is set up for a side-by-side comparison, so that you may view the details of two crops at once, or two successions of one crop, or one succession versus the total crop.
"Distribution Report" This gives you a breakdown of how many units of each crop were distributed through each channel and how much revenue is associated with each.
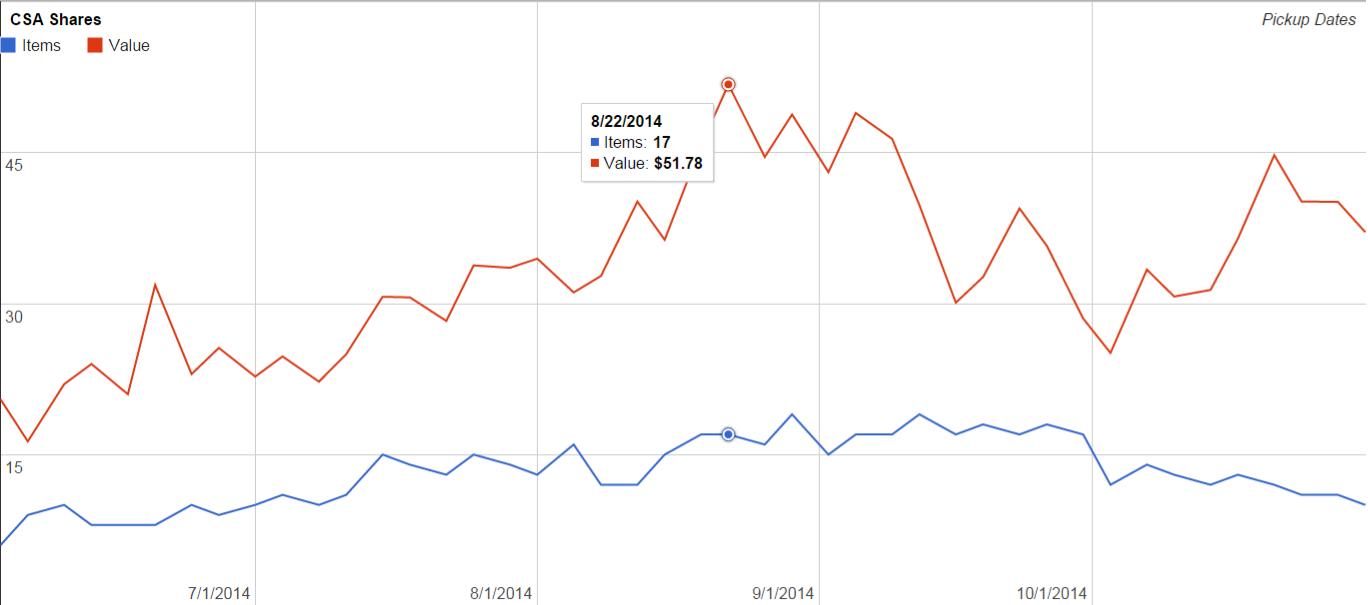
"CSA Chart" This is a graph of the number of items in each share and the value of each share over the course of the season. Click the "View Mode" eyeball near the upper-left corner and you can mouse over the lines of the graph to get data point-by-point. This sheet isn't protected, so try not to change the chart settings.
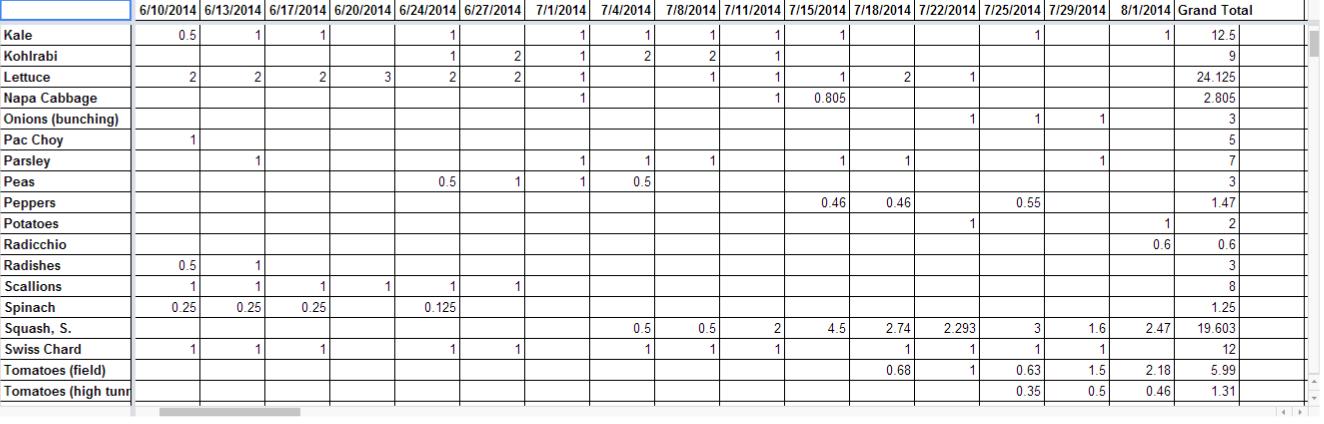
"CSA Grid" This report was requested by a farmer beta-tester to look back over the season and see which crops were distributed to the CSA when. It is useful for planning purposes.
"Summary" Finally, there is a "Summary" of all the crops, showing cost, cost/ft., value, value/ft., potential profit, and profit/ft.
The order of the sheets can be changed by simply dragging and dropping the tabs into the order you prefer. Please do not change the order of the sheets on the public Farm Hack copy, but feel free to do so on your own copy if you sign up using the link below. The initial order is intended to be used for setup, but you will probably want to move the "WorkLog" sheet to the front for day-to-day use, and you may want to rearrange the various reports based on their usefulness to you.
Sign Up If you would like your own copy with free support, please click here.
Technical Support Contact Bill: illyblc@gmail.com or post a message here.
Next Steps: I am working on more comprehensive reports that could be used for planning and budgeting the next season. I also want to introduce a calculator for costs that are specific to individual distribution venues.
Also, I am looking for other features that people think could be useful. For example, one farmer told me that he would like it to calculate seed-buying needs based on the planting records. Another farmer asked if I could compare actual yields to the ideal potential yield. Once I have some more ideas I will look into what is actually possible on which platforms and then make a decision.
Coming soon are a more thorough instructions document and a document to track versions (this is v 0.5) and future aims.
There are also more than 100 beta testers signed up so far, which is great. If anyone else wants in, let me know soon! I'll help with setup and provide tech support in exchange for general feedback.
Note Record-keeping and analysis go hand in hand with crop planning. Please check out Todd Jones's Crop Planning Tool!